现在玩nas的人越来越多,nas一般没有屏幕,无法随时监控运行状态,于是就有了图灵智显,这是一个硬件(屏幕+有线连接)+软件的实现方法。这里使用远古时代的iphone5s当屏幕,配合软件实现监控nas状态。
iphone5s的浏览器已经不能解析复杂的js文件,本文使用shell脚本采集系统状态数据,再用简单的html文件定时刷新来显示状态信息。
状态数据采集脚本
/usr/local/bin/status.sh:
1
2
3
4
5
6
7
8
9
10
11
12
13
14
15
16
17
18
19
20
21
22
23
24
25
26
27
28
29
30
31
32
33
34
35
36
37
38
39
40
41
42
43
44
45
46
47
48
49
50
51
52
53
54
55
56
57
58
59
60
61
62
63
64
65
66
67
68
69
70
71
72
73
74
75
76
77
78
79
80
81
82
83
84
85
86
87
88
89
90
91
92
93
94
95
96
97
98
99
100
101
102
103
104
105
106
107
108
109
110
111
112
113
114
115
116
117
118
119
120
121
122
123
124
125
126
127
128
129
130
131
132
133
134
135
136
137
138
139
140
141
142
143
144
145
146
147
148
149
150
151
152
153
154
155
156
157
158
159
160
161
162
163
164
165
166
167
168
169
170
171
172
173
174
175
176
177
178
179
180
181
182
183
184
185
186
187
188
189
190
191
192
193
194
195
|
INTERFACE="enp4s0"
JSON_FILE="/var/www/html/status.json"
NET_FILE="/tmp/net_cache.txt"
MOUNT_POINT="/vol1/docker/overlay2/bfe25ec30f56cc56436cad793bedce52eaf4b0ce409409a65c64a4742e98bdb5/merged"
format_speed_simple() {
local bytes_per_sec=$1
if [ -z "$bytes_per_sec" ] || [ $bytes_per_sec -lt 1024 ]; then
echo "0 KB/s"
return
fi
local kb_sec=$((bytes_per_sec / 1024))
if [ $kb_sec -ge 1024 ]; then
local mb_sec=$((bytes_per_sec / 1048576))
local remainder=$(( (bytes_per_sec % 1048576) * 100 / 1048576 ))
echo "${mb_sec}.${remainder} MB/s"
else
local remainder=$(( (bytes_per_sec % 1024) * 100 / 1024 ))
echo "${kb_sec}.${remainder} KB/s"
fi
}
convert_uptime_to_chinese() {
local uptime_str=$(uptime -p | sed 's/up //')
echo "$uptime_str" | sed \
-e 's/ days/天/g' \
-e 's/ hours/小时/g' \
-e 's/ minutes/分/g' \
-e 's/ weeks/周/g'
}
get_network_stats() {
read rx_now tx_now <<< $(grep "$INTERFACE:" /proc/net/dev 2>/dev/null | awk '{print $2, $10}' || echo "0 0")
now=$(date +%s)
if [ -f "$NET_FILE" ]; then
read rx_last tx_last time_last < "$NET_FILE"
else
rx_last=$rx_now
tx_last=$tx_now
time_last=$now
fi
echo "$rx_now $tx_now $now" > "$NET_FILE"
time_diff=$((now - time_last))
[ $time_diff -eq 0 ] && time_diff=1
rx_speed=$(( (rx_now - rx_last) / time_diff ))
tx_speed=$(( (tx_now - tx_last) / time_diff ))
[ $rx_speed -lt 0 ] && rx_speed=0
[ $tx_speed -lt 0 ] && tx_speed=0
download=$(format_speed_simple $rx_speed)
upload=$(format_speed_simple $tx_speed)
total_down=$(printf "%.2f" $(echo "$rx_now / 1073741824" | bc -l 2>/dev/null || echo "0"))
total_up=$(printf "%.2f" $(echo "$tx_now / 1073741824" | bc -l 2>/dev/null || echo "0"))
echo "$download"
echo "$upload"
echo "$total_down"
echo "$total_up"
}
get_disk_info() {
local mount_point=$1
df_output=$(df -h "$mount_point" 2>/dev/null | tail -1)
if [ -n "$df_output" ]; then
usage=$(echo "$df_output" | awk '{print $5}')
total=$(echo "$df_output" | awk '{print $2}')
used=$(echo "$df_output" | awk '{print $3}')
free=$(echo "$df_output" | awk '{print $4}')
if [ -z "$free" ] || [ "$free" = "-" ]; then
total_bytes=$(df -B1 "$mount_point" 2>/dev/null | tail -1 | awk '{print $2}')
used_bytes=$(df -B1 "$mount_point" 2>/dev/null | tail -1 | awk '{print $3}')
free_bytes=$((total_bytes - used_bytes))
free=$(echo "$free_bytes" | awk '{
if ($1 >= 1099511627776) printf "%.1fT", $1/1099511627776
else if ($1 >= 1073741824) printf "%.1fG", $1/1073741824
else if ($1 >= 1048576) printf "%.1fM", $1/1048576
else printf "%.1fK", $1/1024
}')
fi
else
df_output=$(df -h / | tail -1)
usage=$(echo "$df_output" | awk '{print $5}')
total=$(echo "$df_output" | awk '{print $2}')
used=$(echo "$df_output" | awk '{print $3}')
free=$(echo "$df_output" | awk '{print $4}')
fi
echo "$usage"
echo "$total"
echo "$used"
echo "$free"
}
{
net_data=$(get_network_stats)
download_speed=$(echo "$net_data" | head -1)
upload_speed=$(echo "$net_data" | head -2 | tail -1)
total_down=$(echo "$net_data" | head -3 | tail -1)
total_up=$(echo "$net_data" | tail -1)
cpu=$(top -bn1 | grep "Cpu(s)" | awk '{printf "%.1f%%", $2 + $4}')
read mem_usage mem_used mem_total <<< $(free -m | awk 'NR==2{
used_mb=$3; total_mb=$2
printf "%.1f%% %d %d", used_mb*100/total_mb, used_mb, total_mb
}')
disk_data=$(get_disk_info "$MOUNT_POINT")
disk_usage=$(echo "$disk_data" | head -1)
disk_total=$(echo "$disk_data" | head -2 | tail -1)
disk_used=$(echo "$disk_data" | head -3 | tail -1)
disk_free=$(echo "$disk_data" | tail -1)
uptime_chinese=$(convert_uptime_to_chinese)
system_load=$(uptime | awk -F'load average:' '{print $2}' | sed 's/^ *//;s/ *$//')
cat > "$JSON_FILE" << EOF
{
"cpu": "$cpu",
"memory": {
"usage": "$mem_usage",
"used": "${mem_used}MB",
"total": "${mem_total}MB"
},
"disk": {
"mount_point": "$MOUNT_POINT",
"usage": "$disk_usage",
"total": "$disk_total",
"used": "$disk_used",
"available": "$disk_free"
},
"network": {
"download_speed": "$download_speed",
"upload_speed": "$upload_speed",
"total_download": "${total_down} GB",
"total_upload": "${total_up} GB",
"interface": "$INTERFACE"
},
"system": {
"uptime": "$uptime_chinese",
"load": "$system_load",
"time": "$(date '+%Y-%m-%d %H:%M:%S')"
}
}
EOF
}
docker cp /var/www/html/status.json php://var/www/html/
|
INTERFACE:网卡名,用ifconfig获取。
MOUNT_POINT:值是”/“就是整个磁盘,nas有添加的存贮空间,用df -h获取相应路径。
最后一句,nas上的web服务在docker里,这里把状态数据复制到docker里。
chmod +x /usr/local/bin/status.sh
运行脚本得到的json样式:
1
2
3
4
5
6
7
8
9
10
11
12
13
14
15
16
17
18
19
20
21
22
23
24
25
26
27
| {
"cpu": "29.4%",
"memory": {
"usage": "57.0%",
"used": "2179MB",
"total": "3825MB"
},
"disk": {
"mount_point": "/vol1/docker/overlay2/bfe25ec30f56cc56436cad793bedce52eaf4b0ce409409a65c64a4742e98bdb5/merged",
"usage": "48%",
"total": "221G",
"used": "104G",
"available": "117G"
},
"network": {
"download_speed": "1.50 KB/s",
"upload_speed": "1.83 KB/s",
"total_download": "7.75GB",
"total_upload": "6.23GB",
"interface": "enp4s0"
},
"system": {
"uptime": "3天, 11小时, 28分",
"load": "0.19, 0.23, 0.26",
"time": "2026-01-28 11:12:41"
}
}
|
status.html
1
2
3
4
5
6
7
8
9
10
11
12
13
14
15
16
17
18
19
20
21
22
23
24
25
26
27
28
29
30
31
32
33
34
35
36
37
38
39
40
41
42
43
44
45
46
47
48
49
50
51
52
53
54
55
56
57
58
59
60
61
62
63
64
65
66
67
68
69
70
71
72
73
74
75
76
77
78
79
80
81
82
83
84
85
86
87
88
89
90
91
92
93
94
95
96
97
98
99
100
101
102
103
104
105
106
107
108
109
110
111
112
| <!DOCTYPE html>
<html>
<head>
<meta charset="UTF-8">
<meta name="viewport" content="width=device-width, initial-scale=1.0">
<title>NAS状态监控</title>
<meta http-equiv="refresh" content="10">
<style>
body { font-family: sans-serif; margin: 20px; font-size: 16px; }
.section {
border: 1px solid #ccc;
margin: 10px 0;
padding: 10px;
border-radius: 5px;
}
.title {
font-weight: bold;
color: #333;
margin-bottom: 10px;
}
.row {
display: flex;
justify-content: space-between;
margin: 5px 0;
}
.time {
text-align: center;
color: #666;
font-size: 12px;
margin-top: 20px;
}
</style>
</head>
<body>
<div class="section">
<div id="cpu">CPU: 加载中...</div>
<div id="memory">内存: 加载中...</div>
<div id="disk">磁盘: 加载中...</div>
<div id="network">网络: 加载中...</div>
<div id="system">系统: 加载中...</div>
</div>
<div class="time" id="timestamp">最后更新: 加载中...</div>
<script>
function loadStatus() {
var xhr = new XMLHttpRequest();
xhr.open('GET', 'status.json?' + new Date().getTime(), true);
xhr.onreadystatechange = function() {
if (xhr.readyState === 4) {
if (xhr.status === 200) {
try {
var data = JSON.parse(xhr.responseText);
updateDisplay(data);
} catch(e) {
document.getElementById('cpu').innerHTML = '数据解析错误';
console.error('JSON解析错误:', e);
}
} else {
document.getElementById('cpu').innerHTML = '连接失败: ' + xhr.status;
}
}
};
xhr.send();
}
function updateDisplay(data) {
document.getElementById('cpu').innerHTML =
'<div class="row"><span>CPU使用率:</span><span>' + data.cpu + '</span></div>';
document.getElementById('memory').innerHTML =
'<div class="row"><span>内存使用:</span><span>' + data.memory.usage +
' (' + data.memory.used + '/' + data.memory.total + ')</span></div>';
document.getElementById('disk').innerHTML =
'<div class="row"><span>磁盘使用:</span><span>' + data.disk.usage +
' (' + data.disk.used + '/' + data.disk.total + ')</span></div>' +
'<div class="row"><span>可用空间:</span><span>' + data.disk.available + '</span></div>';
var net = data.network;
document.getElementById('network').innerHTML =
'<div class="row"><span>下载速度:</span><span>' + net.download_speed + '</span></div>' +
'<div class="row"><span>上传速度:</span><span>' + net.upload_speed + '</span></div>' +
'<div class="row"><span>总下载:</span><span>' + net.total_download + '</span></div>' +
'<div class="row"><span>总上传:</span><span>' + net.total_upload + ' </span></div>' +
'<div class="row"><span>接口:</span><span>' + net.interface + '</span></div>';
document.getElementById('system').innerHTML =
'<div class="row"><span>运行时间:</span><span>' + data.system.uptime + '</span></div>' +
'<div class="row"><span>系统负载:</span><span>' + data.system.load + '</span></div>';
document.getElementById('timestamp').innerHTML =
'最后更新: ' + data.system.time + ' (每10秒自动刷新)';
console.log('网络数据:', data.network);
}
window.onload = function() {
loadStatus();
setInterval(loadStatus, 10000);
};
</script>
</body>
</html>
|
文件和status.json在同一路径,放在web服务目录下。
定时刷新脚本数据
在crond里添加定时刷新。
crontab -e:在最后添加以下语句
1
2
3
4
5
6
| * * * * * /usr/local/bin/status.sh
* * * * * sleep 10; /usr/local/bin/status.sh
* * * * * sleep 20; /usr/local/bin/status.sh
* * * * * sleep 30; /usr/local/bin/status.sh
* * * * * sleep 40; /usr/local/bin/status.sh
* * * * * sleep 50; /usr/local/bin/nas_status.sh
|
每10秒刷新一次。
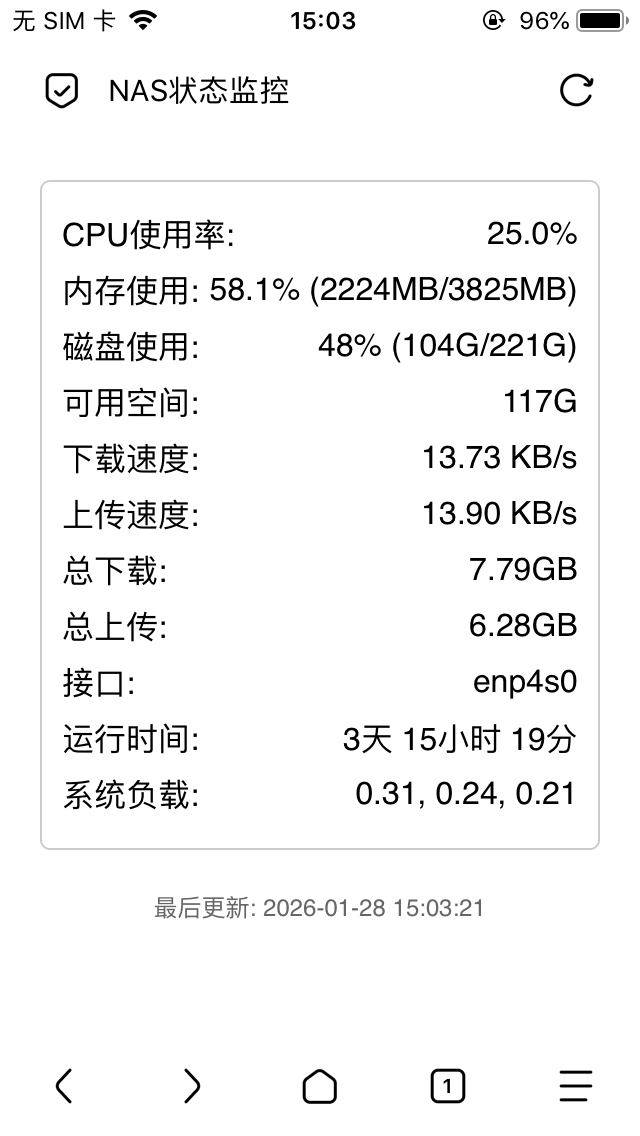
效果图
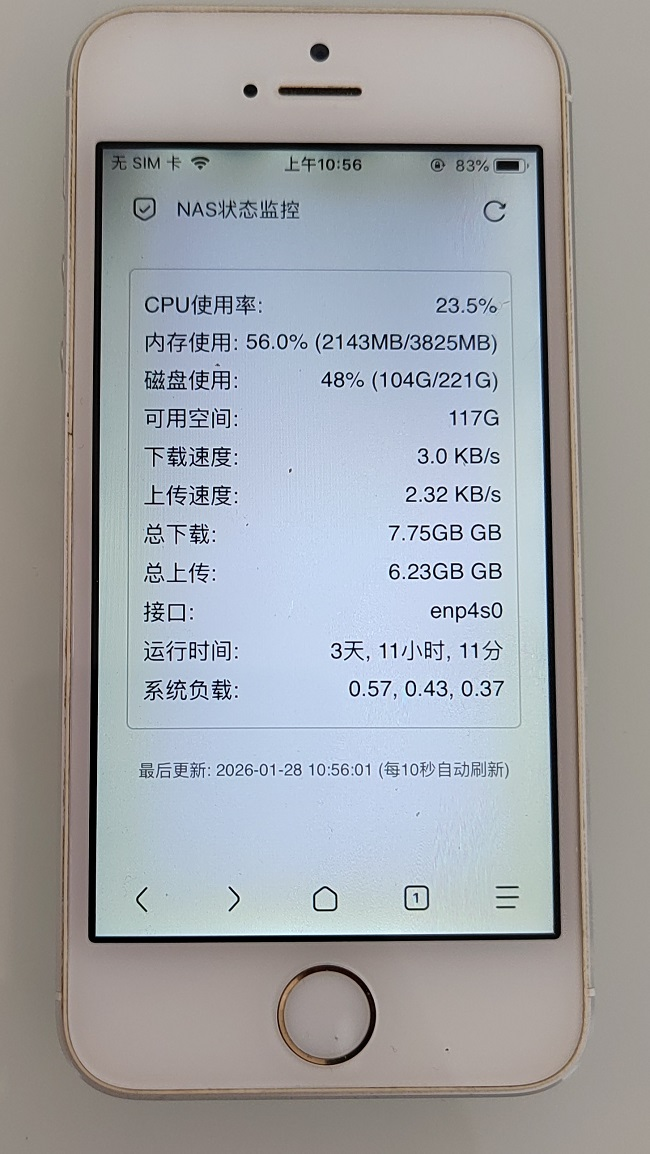
屏幕已经发黄,里面因为拆机换后盖和电池进灰,但作为一个监控副屏,还是能吊打单片机+显示屏做的副屏,充分发挥了一个不锈钢脸盆的价值。
html中的<meta http-equiv="refresh" content="10">会造成页面闪烁,删掉就好了。
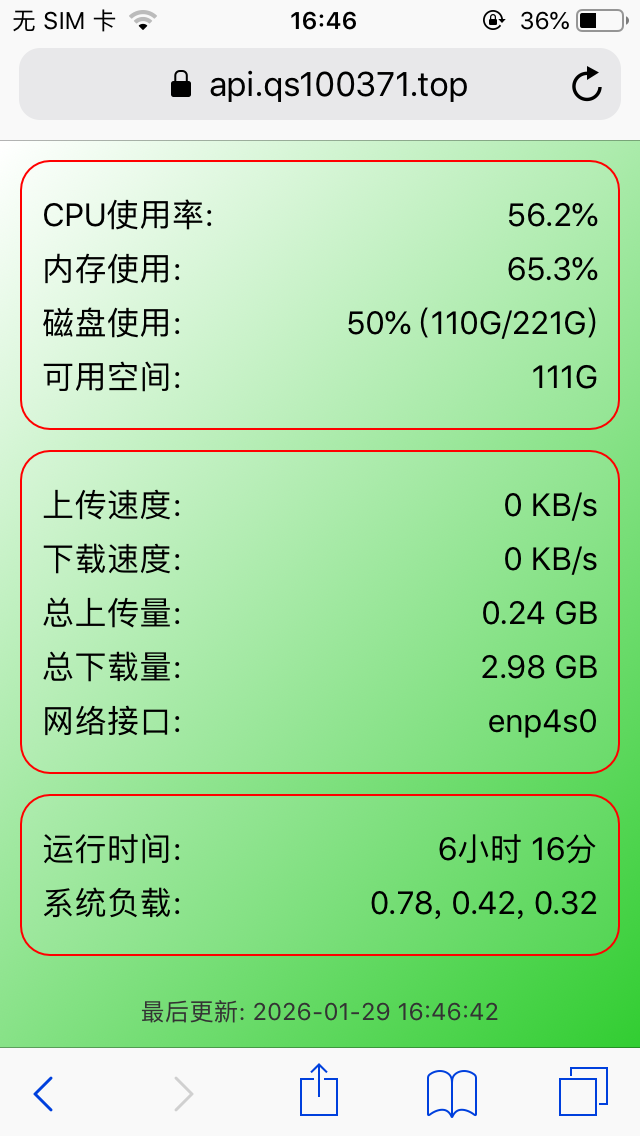
网页特效
由于iphone5s上的ios12.5.8不支持网页背景图,不能做成比较炫酷的效果。style语句只包含新增部分。
渐变色效果:
1
2
3
4
5
6
7
| body {
background: linear-gradient(135deg, #ffffff 0%, #ff1493 100%);
}
.section {
background-color: rgba(255, 255, 255, 0.40);
}
|
动态渐变色效果:
1
2
3
4
5
6
7
8
9
10
| body {
background: linear-gradient(-45deg, #ee7752, #e73c7e, #23a6d5, #23d5ab);
background-size: 400% 400%;
animation: gradient 15s ease infinite;
}
@keyframes gradient {
0% { background-position: 0% 50%; }
50% { background-position: 100% 50%; }
100% { background-position: 0% 50%; }
}
|
以上脚本和网页代码均由deepseek生成,加少量人工修改。